Applying Brendan Gregg's USE Method to a Marine Chartplotter's Android MFD
How to apply the USE Method to diagnose performance bottlenecks on Android-based marine chartplotters.
Applying Brendan Gregg’s USE Method to a Marine Chartplotter’s Android MFD
Most marine multifunction displays (MFDs) — including the Android-based ones now common on recreational boats — run a full Android stack underneath the chartplotter UI: a Linux kernel, cgroups, a Dalvik/ART runtime, and a pile of vendor services for GPS, NMEA2000/CAN bridges, sonar, and AIS. When one of these units feels “laggy” — slow chart redraw, sluggish touch response, dropped AIS targets, stutter when overlaying radar — it’s tempting to guess. Brendan Gregg, who wrote Systems Performance and built much of the modern Linux/BPF tracing toolchain, has spent his career arguing against guessing. His USE Method gives a fast, structured way to find the real bottleneck before touching a single setting.
This article maps his methodology onto a generic Android marine MFD, and lists the concrete tools you can actually run against a locked-down head unit — most of which don’t require root.
Why a marine MFD is a good USE Method candidate
A boat MFD is a constrained embedded Android device: fixed CPU/RAM/storage, running one demanding foreground app (the chart/plotter app) plus background services (NMEA sentence parsing, Wi-Fi/Bluetooth for autopilot or radar, GPS fix updates, sometimes video decode for FLIR/thermal cameras). That’s exactly the kind of bounded, resource-constrained system the USE Method was designed for — it was originally built for servers, but Gregg has repeatedly shown it generalizes to “any system,” including consumer hardware, precisely because the method starts from resources and their limits, not from a fixed toolset.
The method, in one line
For every resource, check Utilization, Saturation, and Errors.
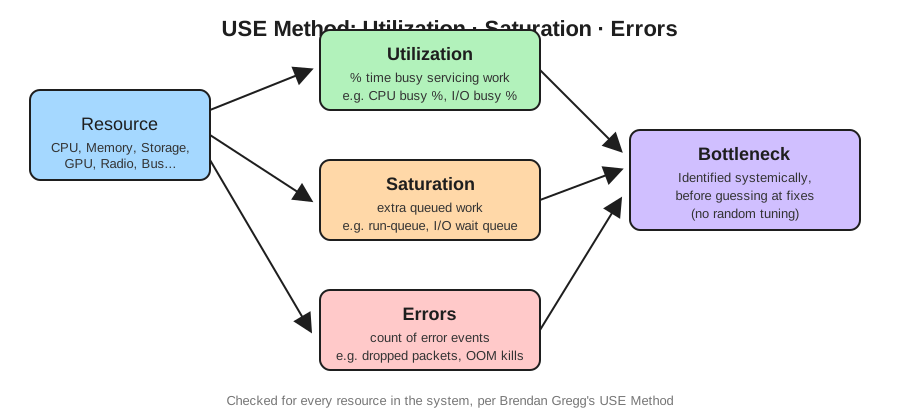 The USE Method: for every resource, check utilization, saturation, and errors before touching a single setting.
- Utilization — percentage of time the resource was busy (CPU busy %, storage I/O busy %).
- Saturation — the degree of extra queued work the resource can’t service (run-queue length, I/O wait queue, memory pressure/swapping).
- Errors — error events (dropped packets, storage I/O errors, OOM kills).
Gregg’s insight worth remembering for a boat MFD specifically: a resource that looks fine on a 5-minute average can still saturate in short bursts — e.g., CPU pinned at 100% for two seconds while re-rendering a chart tile — and that burst is exactly what causes the “stutter” or “input lag” you actually feel. Averages hide this; you need per-second (or better) sampling.
Building your MFD’s USE checklist
The resource list for a boat MFD, adapted from Gregg’s generic hardware list:
| Resource | Utilization | Saturation | Errors |
|---|---|---|---|
| CPU (cores) | % busy per core | run-queue length / scheduling latency | thermal throttling events |
| Memory | used vs total RAM | swap activity, low-memory killer (LMK) events | failed allocations, app OOM kills |
| Internal storage (eMMC/UFS) | % busy, IOPS | I/O wait queue depth | I/O errors, remount-ro events |
| GPU | frame render time / vsync budget | dropped frames, “janky” frames | GPU driver errors |
| Wi-Fi/Bluetooth radio | throughput vs link rate | retransmits, connection drops | radio errors, disconnect events |
| NMEA2000/CAN or serial bus | bus load % (if exposed) | buffer overruns | checksum/parse errors, dropped sentences |
| GPS/GNSS | fix update rate | fix latency, satellites-in-view drop | fix loss events |
| Battery/thermal | current draw / thermal headroom | throttling under sustained load | brownout/undervoltage resets |
The bus/GPS/thermal rows are boat-specific extensions beyond the standard USE hardware list — MFDs live in a hot, vibrating, power-fluctuating environment that a rack-mounted server doesn’t, so it’s worth treating thermal and power as first-class resources here.
Tools that actually work on a locked-down MFD (no root required)
Marine MFDs typically ship as locked, non-rootable Android builds. The good news: Android’s own developer tooling — reachable over ADB via USB or Wi-Fi debugging — covers most of the USE checklist without root, and is the same instrumentation Google documents for regular app performance work.
Enable ADB access. Most Android MFDs have a hidden developer-options or engineering menu (varies by vendor — commonly reached by tapping the version/build number a few times in Settings, or a manufacturer service menu). Enable USB debugging, connect via
adbover USB, or over Wi-Fi withadb tcpip 5555once the first USB pairing is done.CPU utilization and saturation —
adb shell top -d 1for a live per-process view;adb shell dumpsys cpuinfofor a load snapshot. For saturation specifically (run-queue/scheduling latency),adb shell cat /proc/loadavggives you the classic load-average numbers.Memory —
adb shell dumpsys meminfo <package>for a specific app’s Java/native heap, ordumpsys meminfosystem-wide. Watch/proc/meminfo’sMemFree, and look at logcat forlowmemorykiller/Low on memorylines — that’s your saturation signal for memory.Storage I/O —
adb shell dumpsys iostatsgives an app-centric view; for raw device stats,/proc/diskstatsif accessible, otherwiseadb shell cat /sys/block/*/stat.GPU/frame performance — this is usually the actual complaint (“chart redraw is choppy”).
adb shell dumpsys gfxinfo <package> framestatsreports per-frame timing against the 16.6ms (60fps) or 33ms (30fps) budget — a direct saturation metric for the render pipeline. Android’s Perfetto system trace (record via the on-device Developer Options “System Tracing” tool, oradb shell perfetto) gives a full timeline across CPU scheduling, frame rendering, and binder calls, viewable in the Perfetto UI (ui.perfetto.dev) without needing the device attached afterward.CPU profiling (deeper drill-down) — simpleperf is AOSP’s non-rootable equivalent of Linux
perf, and is what Gregg’s own profiling techniques (CPU flame graphs) rely on upstream.simpleperf record/reportworks on a debuggable app process without root and can generate the same kind of CPU flame graph Gregg popularized, letting you see exactly which function is burning CPU during a chart repaint.Network/radio —
adb shell dumpsys wififor link rate/retries,adb shell dumpsys bluetooth_managerfor BT link state — useful if your complaint is autopilot/radar/AIS-over-Wi-Fi lag rather than the chart UI itself.Errors, broadly —
adb logcatfiltered forANR,FATAL EXCEPTION,lowmemorykiller,Watchdog, thermal throttling strings — this is your catch-all errors column across every resource row.
None of this requires root; it’s the same toolchain Android app developers use for normal performance work, just pointed at whichever chart-plotter app and system services are running on the MFD.
A practical workflow
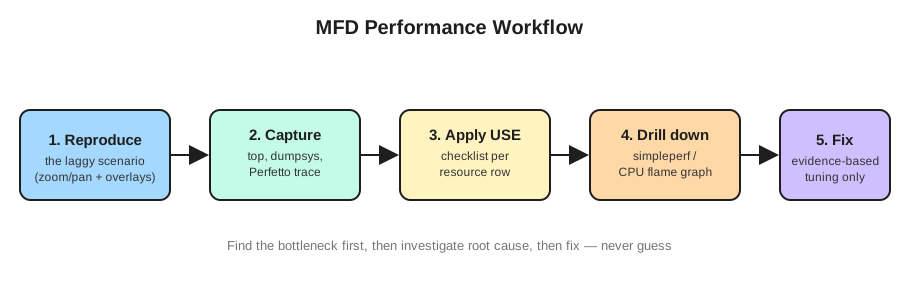 Find the bottleneck first, then investigate root cause, then fix — never guess.
- Reproduce the “laggy” scenario deliberately (e.g., zoom/pan while radar overlay + AIS + autopilot data are all live) while running
top -d 1anddumpsys gfxinfo <pkg> framestatsin two terminals. - Capture a Perfetto system trace across the same window — this gives you the full picture (scheduling, frames, binder IPC) in one place rather than stitching together individual tool outputs.
- Apply the checklist: is the CPU pegged (utilization) or just queued (saturation) at the moment of the stutter? Is a specific frame’s render time blowing the 16.6/33ms budget? Any
lowmemorykilleror ANR lines in logcat at that timestamp? - Once you’ve localized the resource, drill down: if CPU-bound,
simpleperf recordduring the same scenario and generate a flame graph of exactly what’s consuming cycles. - Only after the systemic bottleneck is identified do you look at fixes — this ordering (find the bottleneck first, then investigate root cause, then fix) is the entire point of Gregg’s method: it prevents the “random change” and “streetlight” anti-patterns he explicitly warns against, where you tune settings that feel obviously wrong without evidence they’re actually the bottleneck.
Where this could go for an application
A natural next step, given everything above, is a small on-device (or companion, ADB-driven) tool that:
- Polls
/proc/loadavg,dumpsys meminfo,dumpsys gfxinfo framestats, and logcat error patterns on an interval, - Presents them as a live USE-style dashboard (utilization/saturation/errors per resource row, matching the table above),
- Flags threshold breaches (e.g., frame time > 16.6ms, load average > core count, lowmemorykiller events) as the USE Method checklist made continuous instead of manual.
That’s effectively a purpose-built USE dashboard for marine MFDs — the same idea Gregg cites others (e.g., Circonus) having built for servers, just retargeted at boat electronics.
References and useful links
Brendan Gregg — The USE Method
Brendan Gregg — Performance Analysis Methodology
Brendan Gregg — Systems Performance, 2nd Edition
Android Developers — Overview of system tracing
Perfetto — Recording system traces
Android Developers — dumpsys reference
AOSP — Simpleperf introduction