How to Think Clearly (7/11): Averages Lie
When a few cases carry most of the total, the average describes nobody. Two shapes of the world, and what each asks of a decision.
Where this sits: stage 4 of 6, Estimate. The previous post gave tools for producing a number you do not have. This one is about the shape of the numbers you do have, because an average is the wrong summary when a few cases carry most of the total.
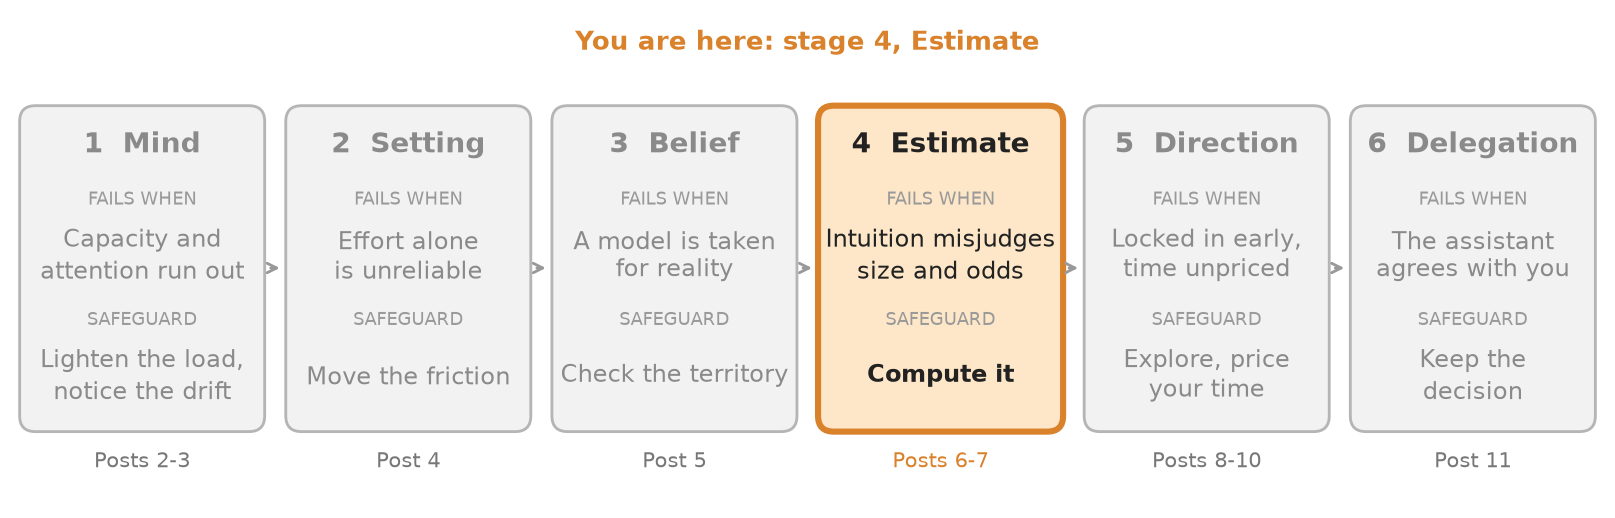 Where this post sits in the series: stage 4 of 6, the Estimate.
Intuition quietly assumes that quantities are bell-shaped: most cases sit near the average, and the extremes are only modestly larger. For heights that is true. For many quantities that matter in decisions it is not. M. E. J. Newman’s review of power laws lists the sizes of cities, earthquakes, wars and personal fortunes among quantities that all appear to follow them. In a power law, a small number of cases are enormous, and the tail is heavy enough that the average stops being a useful description.
What the shape does to an average
Here is a small simulation, which is this post’s own, not a published result. Take a business with 20 customers and an average revenue of 5,000 per customer. In the first world, revenue per customer is bell-shaped with a standard deviation of 1,000. In the second, it follows a power law with a tail index of 1.2, close to the classic 80/20 case, scaled to the same true average. Each world was drawn 20,000 times.
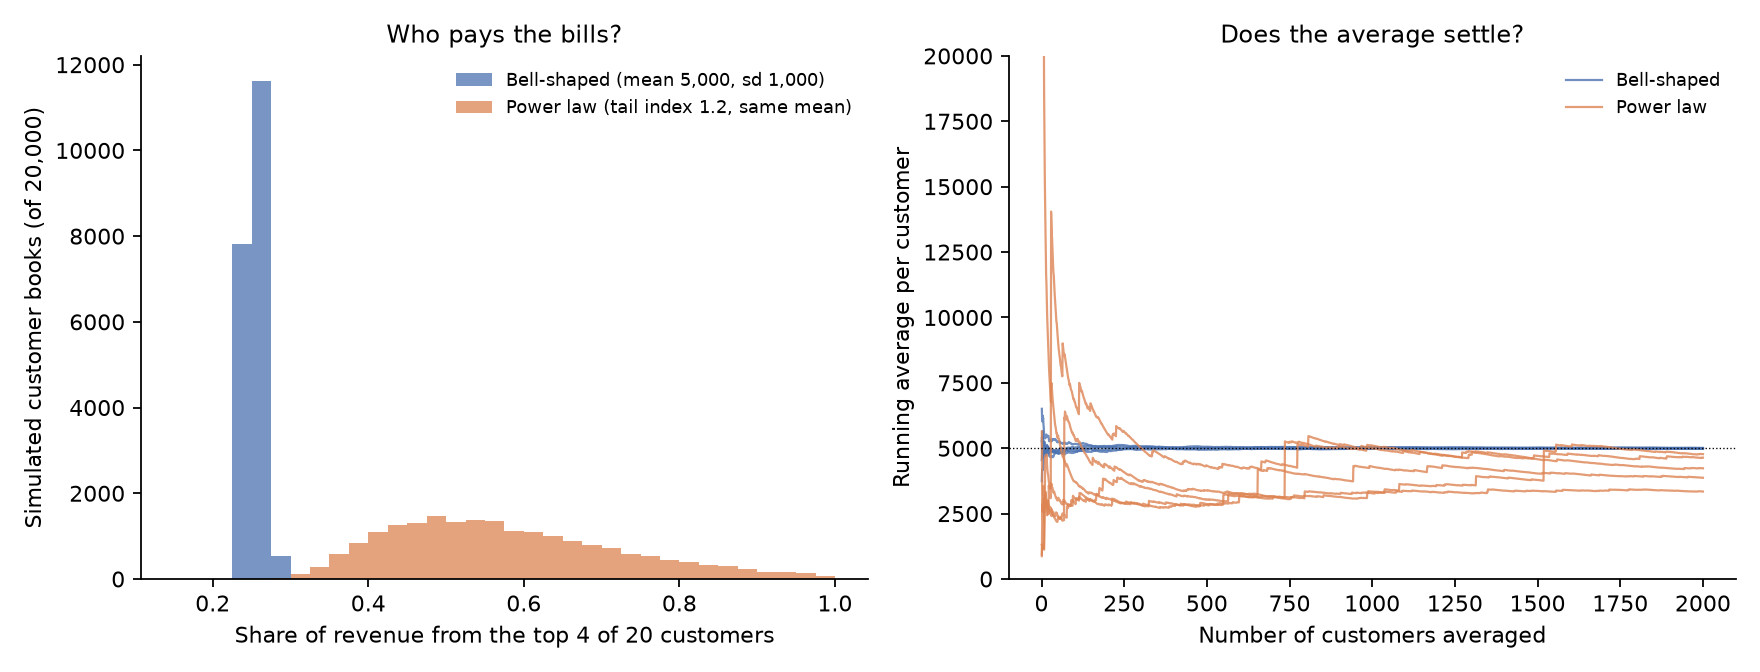 Simulated, same true average in both worlds. Own simulation, 20,000 books of 20 customers.
- In the bell-shaped world, the top 4 customers bring about a quarter of revenue, almost every time (10th to 90th percentile: 24% to 27%). The largest customer brings about 7%.
- In the power-law world, the top 4 bring a median of 56%, and anywhere from 41% to 79% between the 10th and 90th percentiles. The largest customer alone brings a median of 25%.
- The average of 20 customers is stable in the first world, near 5,000. In the second, the median book averages 2,786, well under the true 5,000, with a 10th to 90th percentile range of 1,829 to 6,163. The true average is carried by rare giants that most small samples never contain.
The right panel shows the same thing over time: the running average of the bell-shaped world settles within a few hundred customers, while the power-law paths jump around and mostly remain below the true average even after 2,000 customers.
Two decisions follow. In a bell-shaped world, volume is a reasonable strategy, since every customer is worth about the same. In a power-law world, quality of the head matters more than count: one giant customer equals many ordinary ones, so the work is to find more of them and avoid spending the best hours on the tail.
Real data with this shape
The evidence is not only simulated. Steve Ballmer’s October 2002 memo, written after Microsoft analysed customer error reports, says that about 20 percent of bugs cause 80 percent of all errors, and that one percent of bugs cause half of all errors. Ballmer wrote that Microsoft would use the data to prioritize debugging work.
In finance, Hendrik Bessembinder’s study of US stocks found that the majority of common stocks in the CRSP database since 1926 had lifetime buy-and-hold returns below one-month Treasury bills. Measured in lifetime dollar wealth creation, the best-performing 4% of listed companies explain the net gain of the entire US market, and the other stocks together matched Treasury bills.
The two results differ in what they allow. A bug team can see the head after reports arrive, so it can concentrate. A stock buyer cannot know in advance which 4% will be the head, so the same shape argues for holding broadly. The lesson is not “concentrate”. It is: find out whether the head is visible before choosing where to concentrate. This is the post’s own reading of the two sources.
A caution about the label
“Power law” is easy to assert and hard to prove. In a 2009 paper, Aaron Clauset, Cosma Shalizi and Newman tested 24 real-world datasets that had each been conjectured to follow a power law. In some cases the conjecture was consistent with the data, and in others the power law was ruled out. For decisions the exact label matters less than the question it stands for: does a handful of cases carry most of the total? That can be checked by sorting the list and reading the top.
The other shape: a chain
A power law concerns sums, where a few items dominate. A different structure concerns products, where every step has to work. Michael Kremer’s O-ring theory of economic development models production as a process subject to mistakes in any of several tasks, so that quantity cannot be substituted for quality and small differences in skill lead to large differences in output.
The arithmetic is simple, and the following numbers are the post’s own. A process with three steps that succeed 95%, 70% and 95% of the time succeeds 63% of the time overall. Raising the weak step from 70% to 95% lifts the process to 86%. Raising one of the strong steps from 95% to 99% lifts it only to 66%. In a chain, the weakest link takes the work. In a power law, the head takes it.
In machine learning: two shapes
Both shapes show up in how models are built and how they fail.
The first is a power law between resources and results. In Kaplan et al.’s 2020 study, language-model loss scales as a power law with model size, dataset size and training compute, with some trends spanning more than seven orders of magnitude. This is a different object from a few cases dominating a total: it describes how a result changes as resources grow, not how a total divides among cases. The lesson carries over anyway, because the shape decides which expectation is honest. On a power law, multiplying resources by ten multiplies the loss by the same factor at every scale, within the range where the fit holds. Absolute gains therefore shrink as the baseline improves, and a forecast extrapolated linearly from the last few steps misleads.
The second is the chain. In a 2011 paper, Stéphane Ross, Geoffrey Gordon and Drew Bagnell study sequential prediction, such as imitation learning, where future observations depend on earlier predictions. That breaks the i.i.d. assumption most statistical learning rests on, with poor performance in theory and often in practice. In a bound they discuss, a policy with error ε per step on the expert’s states can make as many as T²ε mistakes over T steps, because one mistake can lead to situations the training data never showed. That is worse than the product of independent steps above: in a sequence, an early error changes what the later steps face. The comparison and its application to multi-step AI agents, whose steps also depend on earlier ones, are this post’s own inference. The paper’s remedy lets the learner’s own actions determine the states on which expert demonstrations are collected.
Choosing the question
When looking at outcomes across many items, such as customers, products or decisions, sort them and look at the top: that is a power-law question, and the move is to feed the head and stop feeding the tail. When looking at one process made of steps, ask which step is weakest: that is a chain question, and the move is to fix the bottleneck. The average answers neither question.
The next stage turns from estimating to direction, starting with the most overlooked number in any plan: what an hour of one’s own time is worth.
Series: How to Think Clearly. 1. Where Thinking Breaks and What to Put There. 2. A Thought Has a Machine Behind It. 3. Catch the Error While It Happens. 4. Make the Right Thing the Easy Thing. 5. The Map Is Not the Territory. 6. Three Tools for Estimating the Unknown. 7. Averages Lie. 8. Price Your Own Hour. 9. Explore Early, Exploit Late, Imagine the Failure First. 10. The Hill You Are Standing On. 11. Let AI Think, Keep the Decision.